
 Trustpilot


POPULAR COURSES

ALL COURSES
POPULAR LICENCES
ALL LICENCES
- Cash and Valuables in Transit (CVIT) Licence
- CCTV Licence
- Close Protection Licence
- Door Supervisor Licence
- How to get an SIA Licences
- Key Holding Licence
- Security Guard Licence
- SIA Licence Bangladesh Passport
- SIA Licence Ghanaian Passport
- SIA Licence Indian Passport
- SIA Licence Irish Passport
- SIA Licence Nigerian Passport
- SIA Licence on Pakistani Passport
- SIA Licence Poland Passport
- SIA Licence Romanian Passport
- SIA Licence South African Passport
POPULAR COURSES
ALL LOCATIONS
ALL CAREERS
- ARC Operator
- Area Relief Security Officer
- Close Protection Officer
- Control Room Operator
- Corporate Security Officer
- Distribution Security Officer
- Front of House Officer
- Key Response Officer
- Loading Bay Supervisor
- Mobile Security Supervisor
- Night Shift Security Officer
- Nightclub Doorman
- Retail Security Officer
- Security Command Centre Manager
- Security Concierge
- Security Manager
- Security Patrol Officer
- Static Security Officer
- Venue Security Officer

Britain’s Most Dangerous Drivers
by Get Licensed | May 26, 2025 | Reading Time: 5 mins
Every year, over 132,977 people are injured on UK roads, with a further 30,000 people killed1. These casualties are often attributed to dangerous driving, but where in the country are drivers most at risk?
Our experts reveal the most dangerous driving areas in Britain for drivers based on collision rates, drink-driving incidents, and vehicle thefts. London boroughs dominate the list, with Lambeth outranking all local authorities for the most collisions per 1,000 registered motor vehicles.
Understanding where and why motor vehicle accidents occur is critical, but monitoring and preventing them is equally important. Trained operators with a CCTV licence can be the first line of defence in identifying dangerous drivers and promoting safety on roads.
Areas With the Most Road Collisions in Britain (London Boroughs)
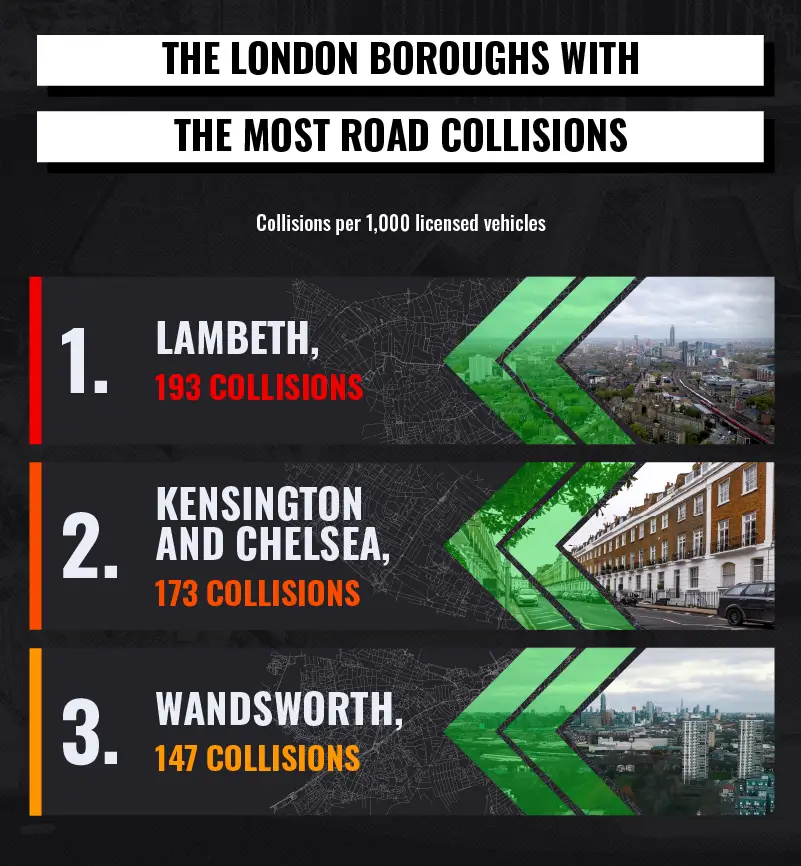
1. Lambeth, London - 193 collisions per 1,000 licensed vehicles
Lambeth experiences the most collisions for the number of licensed vehicles in the area, with 193 per 1,000, including incidents with cars, vans, and motorcycles.
Lambeth is in the top 10 local authorities for motorcycle casualties, with 74 per 1,000 licensed vehicles, and is the third local authority for pedestrian casualties, with 6.5 injured per 10,000 residents.
2. Kensington and Chelsea, London - 173 collisions per 1,000 licensed vehicles
The Kensington and Chelsea London borough has more collisions per 1,000 licensed motor vehicles than most English local authorities, at 173 per year.
The area had a rate of fatal collisions of 0.8 per 1,000 vehicles. Kensington and Chelsea have more motorcycle casualties than any other area in Britain, with 119 per 1,000 licensed motorcycles. The London borough is also top for pedal cyclists and pedestrian casualties.
3. Wandsworth, London - 147 collisions per 1,000 licensed vehicles
Wandsworth is Britain’s third most dangerous local authority, and the third London borough in the top three. The area experienced 147 motor vehicle accidents per 1,000 vehicles, but despite this, it only had three fatal collisions in a year.
Areas With the Most Road Collisions Outside London
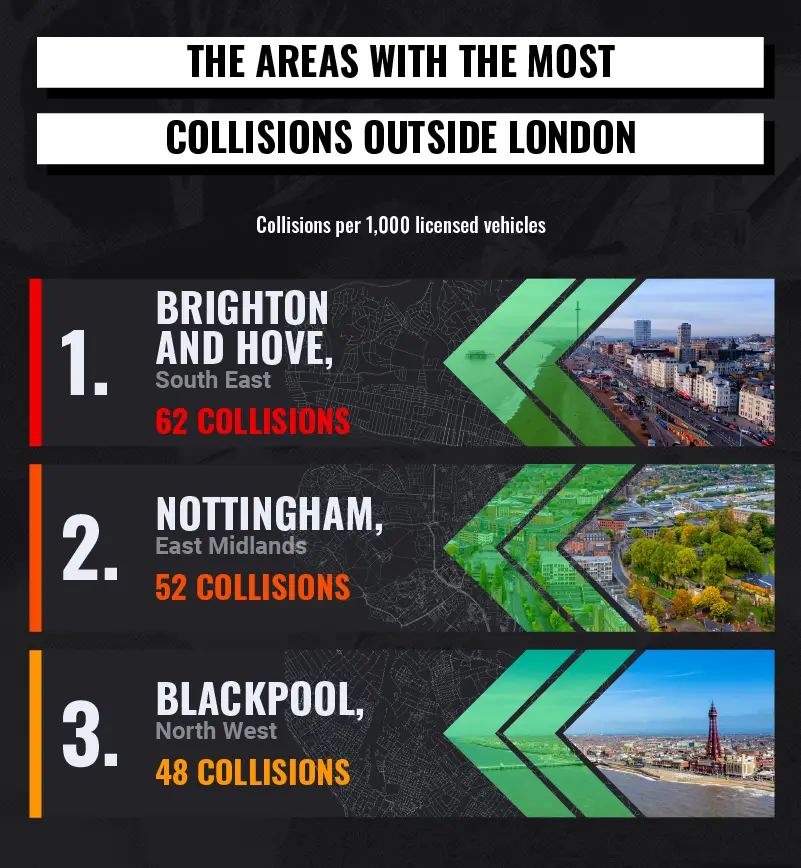
1. Brighton and Hove, South East - 62 collisions per 1,000 licensed vehicles
Brighton and Hove has more collisions than any other local authority outside London. There are 62 accidents per 1,000 motor vehicles, despite the area having just three fatal collisions per year. This is still far fewer than the number of collisions in many London boroughs, with Lambeth having over triple that at 193 collisions per 1,000 licensed vehicles.
2. Nottingham, East Midlands - 52 collisions per 1,000 licensed vehicles
Nottingham is home to more collisions than any other local authority in the East Midlands. The city saw 52 collisions per 1,000 vehicles registered in the area, including 23 fatal collisions in total. In contrast, the second-place London borough, Kensington and Chelsea, had 173 collisions per 1,000 licensed vehicles – more than triple the rate of Nottingham.
3. Blackpool, North West - 48 collisions per 1,000 licensed vehicles
Blackpool is the most dangerous local authority in the North West for road collisions. The city has 48 collisions per 1,000 motor vehicles, and four fatal collisions a year. Blackpool is still far safer than the third-place London borough for collisions – Wandsworth saw more than 101% more accidents per 1,000 motor vehicles.
Areas With the Fewest Road Collisions in Britain
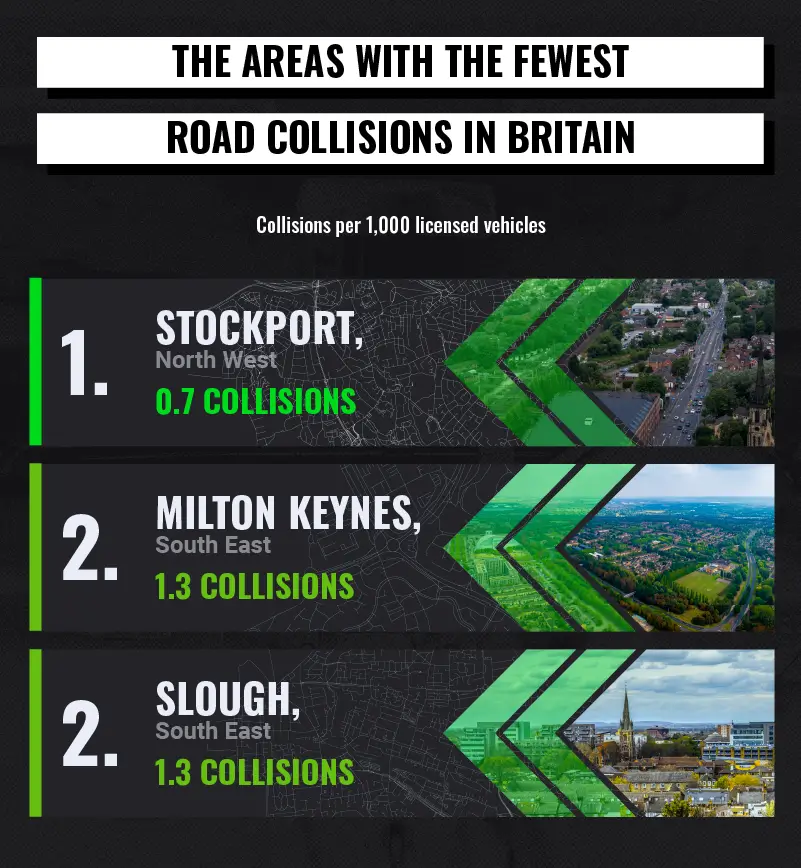
1. Stockport, North West - 0.7 collisions per 1,000 licensed vehicles
Stockport is the local authority with the fewest road collisions in Britain, with just 0.7 per 1,000 vehicles.
Around 2% of all crashes in the location were fatal, and there were just four motorcycle casualties per 1,000 registered motorcycles – a drastic comparison to the 119 motorcycle accidents per 1,000 vehicles that took place in Kensington and Chelsea.
2. Milton Keynes, South East - 1.3 collisions per 1,000 licensed vehicles
Those in Milton Keynes are among the least likely in Britain to be involved in a road collision, as the local authority had just 1.3 per 1,000 licensed motor vehicles.
Of these road accidents, only 1% were fatal, and there were just eight motorcycle casualties per 1,000 motorcycles in the area.
3. Slough, South East - 1.3 collisions per 1,000 licensed vehicles
The second South Eastern local authority in our top three, Slough, has among the fewest road collisions in Britain, with just 1.3 per 1,000 licensed vehicles.
None of these were fatal accidents, making the area one of the safest to travel by road. Slough has the highest rate of motorcycle incidents in our top three, with 21 motorcycle casualties per 1,000 vehicles. It places 32nd in Britain, below local authorities like Nottingham, Reading, and Liverpool.
Areas With the Most Fatal Collisions in Britain
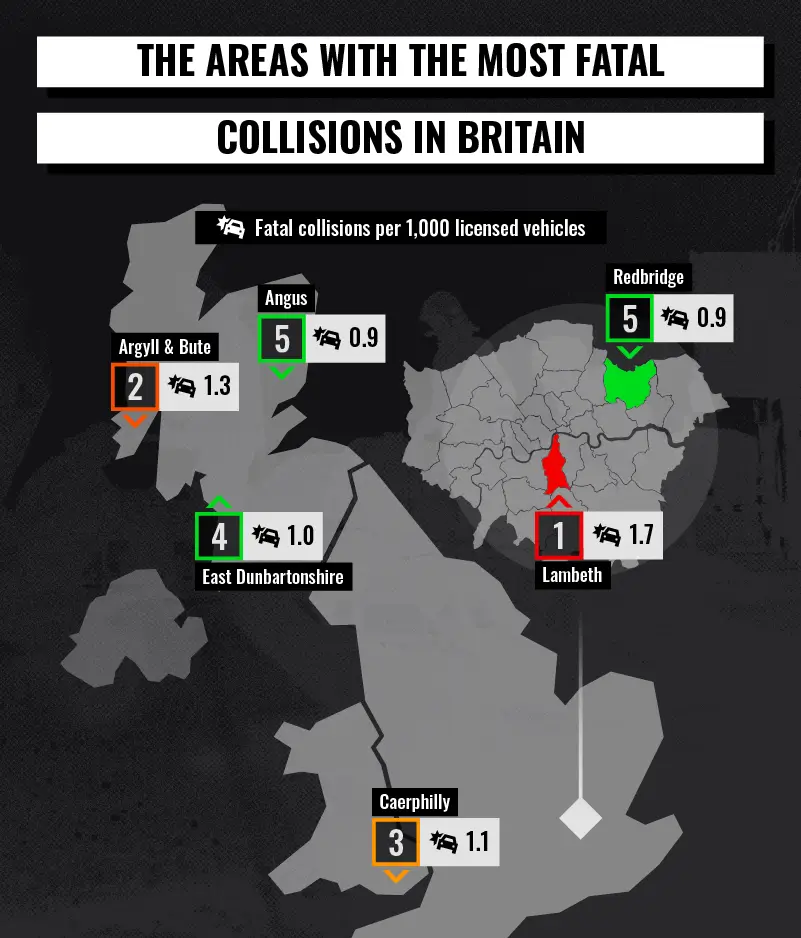
The London borough of Lambeth has 1.7 fatal motor vehicle collisions per 1,000 licensed motor vehicles, more than any other area. This reflects the nature of driving in the area, given that it ranks as Britain’s top local authority for road collisions when normalised by number of vehicles.
Lambeth is closely followed by Argyll and Bute, with 1.3 fatal collisions per 1,000 registered vehicles, and Caerphilly with 1.1.
The Most Dangerous Regions For Drink-Driving Collisions
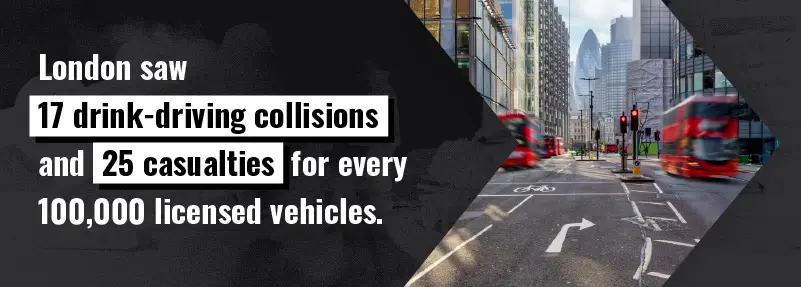
London tops the list for drink-driving collisions and drink-driving casualties, with 17.3 accidents and 24.7 injured people per 100,000 licensed motor vehicles. These figures include all London boroughs, making the area the most dangerous in Britain for alcohol-related accidents. In Britain, drink-driving fatalities have increased by 30% in the last 10 years, meaning it is now more imperative than ever before for road users to take caution.
1. London - 17.3 drink-driving collisions per 100,000 licensed vehicles
England’s capital sees more road accidents resulting from drink-driving than any other area. There were 17.3 collisions and 24.7 casualties per 1,000 licensed vehicles due to drink-driving in 2022. The UK’s legal limit for driving after having consumed alcohol is 80mg/100ml blood or 35ug/100ml breath.
2. East Midlands - 16.6 drink-driving collisions per 100,000 licensed vehicles
Closely behind London, the East Midlands sees more drink-driving accidents than most other regions in Britain. The area covering cities like Nottingham, Derby, and Leicester had 16.6 collisions and 22.9 casualties coming from road accidents where alcohol consumption was a contributing factor.
3. South East - 14.4 drink-driving collisions per 100,000 licensed vehicles
The South East is the third English region in the top three for drink-driving collisions and casualties. In 2022, the area saw 14.4 drink-driving road collisions that resulted in 20.3 casualties, just under 20% fewer casualties than in London.
Tackling Drink-Driving in High-Risk Regions: The Role of Door Supervisors
With alcohol-related road accidents disproportionately affecting regions like London, the East Midlands, and the South East, the role of door supervisors at pubs, clubs, and late-night venues becomes increasingly important. These professionals are often the first to recognise and respond when someone under the influence may attempt to drive, playing a subtle but essential role in reducing drink-driving incidents.
Door supervisors working in venues authorised to sell alcohol must hold a valid SIA door supervisor licence, which includes training in conflict management, incident handling, and identifying vulnerable or intoxicated individuals. In areas with elevated drink-driving risks, their presence acts not only as a deterrent but also as a proactive safeguard supporting both venue and public safety.
Areas With the Most Vehicle Offences per 1,000 People
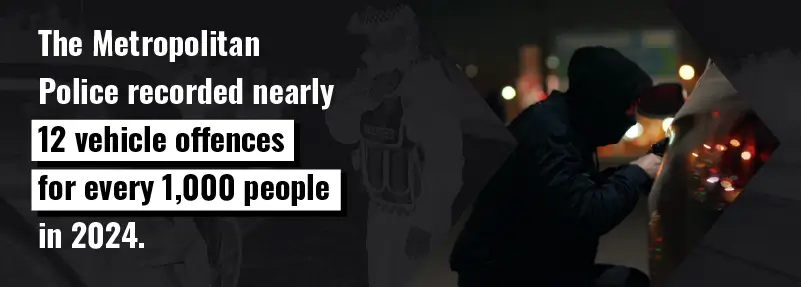
1. Metropolitan Police - 11.8 vehicle offences per 1,000 people
The Metropolitan Police Service, covering Greater London, excluding the City of London, oversees the area with the most vehicle offences. In 2024, there were 11.8 vehicle offences for every 1,000 people that the police force oversees. These vehicle offences can include vehicle theft or tampering with a motor vehicle.
2. West Midlands - 11.1 vehicle offences per 1,000 people
West Midlands Police is in second place, among the police force areas with the most vehicle offences. Last year, 11.1 vehicle offences were recorded for every 1,000 people in the police area.
At a time when keyless car theft, or ‘relay theft’, is rife, many are falling victim to thieves stealing their vehicles by capturing the key signal from outside their homes.
3. South Yorkshire - 8.6 vehicle offences per 1,000 people
South Yorkshire is another area where vehicle offences are more common, with 8.6 recorded offences per 1,000 people in 2024. Vehicle owners across the country are advised to lock their vehicles, use measures such as gear stick and steering wheel locks, and park in safe and secure locations.
The Most Dangerous Areas in Britain For Motorcyclists, Pedal Cyclists, & Pedestrians
Kensington and Chelsea has more motorcycle casualties than any other local authority in Britain, with 119 injured motorcyclists per 1,000 licensed vehicles in the borough. It is also home to more pedal cycle casualties per population than any other area, with 11.7 per 10,000 people.
Pedestrians are also at risk in Kensington and Chelsea, with 9.7 casualties per 10,000 residents.
| Rank | Local authority | Region/ Country | Motorcycle casualties per 1,000 licensed vehicles | Pedal cyclist casualties per 10,000 people | Pedestrian casualties per 10,000 people |
|---|---|---|---|---|---|
| 1 | Kensington and Chelsea | London | 119 | 11.7 | 11.7 |
The Most Dangerous Area Outside London For Motorcyclists & Pedestrians

While Kensington and Chelsea experience more casualties than any other British local authority, the most dangerous area outside London is Liverpool. The city sees 24 motorcycle casualties per 1,000 licensed motorcycles, ranking 28th in Britain.
It is also the city with the most pedestrian casualties, with 5.9 per 10,000 people.
| Rank | Local authority | Region/ Country | Motorcycle casualties per 1,000 licensed vehicles | Pedestrian casualties per 10,000 people |
|---|---|---|---|---|
| 1 | Liverpool | North West | 24 | 5.9 |
The Most Dangerous Local Authority Outside London For Pedal Cyclists

The Cornish archipelago, the Isles of Scilly, has more pedal cyclist casualties than any other area outside London. There are nine pedestrian casualties per 10,000 people, placing the area joint ninth in all of Britain, tied with Wandsworth.
| Rank | Local authority | Region/ Country | Pedal cyclist casualties per 10,000 people |
|---|---|---|---|
| 1 | Isles of Scilly | South West | 9.0 |
Common Reasons For Road Collisions in Britain
The biggest contributor to road collisions in Britain is driver/ rider error or reaction, responsible for over a third (38.2%) of all accidents. This includes dangerous drivers failing to look at the road and their surroundings properly, overshooting junctions, making poor manoeuvres, sudden braking, and other circumstances.
This suggests that road users should take increased caution to drive safely, ensuring they are aware of their surroundings at all times and avoid making decisions without looking properly at the road.
Another contributing factor is a lack of experience or dangerous driving behaviour, which is responsible for over one in six (16%) collisions. This can often be attributed to reckless or dangerous driving, aggressive driving, or panic.
| Rank | Contributory factor | Percentage of collisions |
|---|---|---|
| 1 | Driver or Rider error or reaction | 38.2% |
| 2 | Behaviour or inexperience | 16.0% |
| 3 | Injudicious action | 13.5% |
| 4 | Impairment or distraction | 11.0% |
| 5 | Road environment contributed | 7.4% |
| 6 | Pedestrian only (casualty or uninjured) | 6.6% |
| 7 | Vision affected by external factors | 6.1% |
| 8 | Vehicle defects | 1.3% |
How Get Licensed Supports Safety on Roads Through CCTV Training
At Get Licensed, we understand how crucial surveillance is in improving road safety, especially in high-risk areas like Lambeth and Kensington and Chelsea. Trained CCTV operators help identify dangerous driving behaviour, assist in real-time incident reporting, and provide essential support to law enforcement.
Our CCTV training course is SIA-approved and designed to equip you with the skills needed to become a licensed CCTV operator in the UK. These professionals play a key role in traffic monitoring, accident prevention, and enhancing public safety.
Whether it’s overseeing intersections or monitoring car parks, a career in CCTV surveillance offers the chance to make a real impact. Get Licensed also offers training in door supervision and security guarding, giving you more ways to contribute to safer communities.
Methodology
Collisions and fatal collisions by local authority were sourced using the Department for Transport Road Safety Statistics: RAS0403 (2023) and normalised to licensed motor vehicles using the Department for Transport Vehicle Licensing Statistics: VEH0105 (2023).
Contributory factors to collisions were sourced using the Department for Transport Road Safety Statistics: RAS0705 (2023), looking at the most common causes of collisions and fatal collisions by region & country. These figures were totalled to calculate the most common reasons for collisions in Britain.
Collisions by road user type were sourced using the Department for Transport Road Safety Statistics: RAS0403 (2023) and normalised to licensed motor vehicles using the Department for Transport Vehicle Licensing Statistics: VEH0105 (2023). The following local authorities were removed due to insufficient data: Cumberland Westmorland and Furness, Comhairle nan Eilean Siar, London Airport (Heathrow), Westminster, and City of London.
Drink drive collisions and casualties by region and country were sourced using the Department for Transport Road Safety Statistics and normalised to licensed vehicles using the Department for Transport Vehicle Licensing Statistics: VEH1104 (2022 Q4 end December). Figures were rounded to one decimal place.
Vehicle theft offences per 1,000 people were sourced using the Office for National Statistics Crime in England and Wales: Police Force Area data tables (2024).
Launch your career as a
Security Guard in the UK
Learn how to start your career in UK security industry.
Explore Courses


Find work, try mock tests and book courses from
the UK’s #1 app for security professionals


Get Licensed helps you get SIA trained, licensed, and ready for real security jobs — trusted by 450,000+ people across the UK.


